Understanding Data Types and Sampling Methods
Classified in Mathematics
Written on in  English with a size of 64.79 KB
Qualitative and Quantitative Variables
Qualitative: variables that are not numerical. They represent categories or groups that the data can fall into. Nominal: the categories do not have a natural order or ranking. The key characteristic of nominal variables is that the different categories are mutually exclusive and there is no inherent order to the categories. Ordinal: the categories have a logical or natural order. However, the distances between the categories are not necessarily meaningful.
Quantitative: variables that represent quantities and can be measured numerically. Discrete: a type of quantitative variable that can take on a countable number of distinct values. These are typically values that you can list or count. They often represent things that can be counted in whole numbers. Continuous: can take on an infinite number of values between any two values. They are often measurements and can include fractions or decimals. Continuous variables represent quantities that can be divided into ever finer increments.
Types of Quantitative Variables
Interval: a type of quantitative variable where there is a meaningful order or ranking, and the differences between values are consistent. However, interval variables do not have a true zero point. This means that ratios between numbers are not meaningful. Ratio: Ratio variables are similar to interval variables in that they have a meaningful order and consistent intervals between values. However, ratio variables also have a true zero point, which means that ratios between numbers are meaningful. This true zero point indicates the absence of the quantity in question.
Sampling Methods
Simple Random Sampling (SRS)
Definition: Each member has an equal chance of selection.
With Replacement: Selected members may be chosen more than once.
Without Replacement: Once chosen, members cannot be selected again.
Factorials: Used to calculate possibilities (e.g., N! for total permutations).
Permutations: Number of ways to arrange a subset (e.g., P(n,r) = n! / (n-r)!).
Stratified Random Sampling
Purpose: Ensure representation of subgroups.
Within Strata: Random samples from each stratum.
Proportional vs. Non-Proportional: Sample size can be based on stratum size or other factors.
Usage: When the population has distinct subgroups (strata).
Cluster Sampling
Population Division: Into groups known as clusters.
Sample: Random selection of clusters, including all individuals within chosen clusters.
Suitability: For large, geographically dispersed populations.
Systematic Sampling
Selection: Regular intervals from an ordered list.
Starting Point: Randomly chosen.
Interval: Fixed, predetermined gap between selected members.
Convenience Sampling
Selection Based On: Availability and willingness to participate.
Rigor: Considered less rigorous due to non-random selection.
Multistage Cluster Sampling
Division: Population into clusters at multiple levels.
Sampling: At each level in stages.
Complexity: More complex due to multiple stages.
Randomized Response Sampling
Design: To counteract potential falsehoods in sensitive surveys.
Method: Participants are given two questions, one related to the study and another unrelated.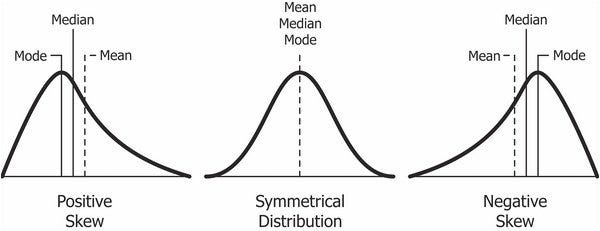


A class is one of the categories into which qualitative data can be classified. The class frequency is the number of observations in the data set falling into a particular class. The class relative frequency is the class frequency divided by the total number of observations in the data set; The class percentage is the class relative frequency multiplied by 100.
The Central Tendency of the set measurements - that is, the tendency of data to cluster, or center, about certain numerical values. The Variability of the measurements - that is, the spread of the data.


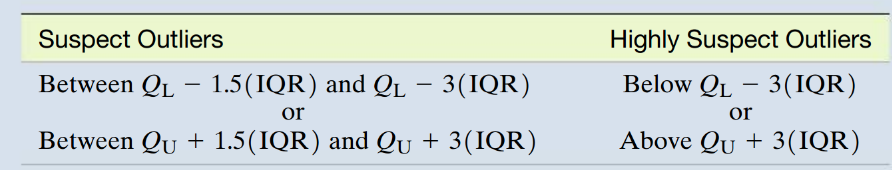
 Zscore is distance from mean Z>2 possible OutlierZ>3 outlier IQR=UpperQuartile-LowerQuartile
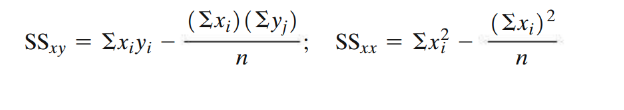
Bivariate data is data on each of two variables, where each value of one of the variables is paired with a value of the other variable. Two variables for each individual X = Explanatory variable (independent) Y = Response variable (dependent).