Macroeconomic Fundamentals: Indicators, Cycles, and Policy
 English with a size of 21.36 KB
Gross Domestic Product
Gross Domestic Product (GDP) is a measurement of the market value of all final goods and services produced in a country during a given period. It is used to show how well an economy is performing compared to previous years.
GDP Inclusions and Exclusions
- GDP includes: Production within a country by foreign firms.
- GDP excludes: Foreign production by a country's firms.
Example: Clothing or products produced in China but sold in the United States would not be part of the U.S. GDP; instead, they would be part of China's GDP.
Intermediate Goods and Services
Intermediate goods and services are goods and services purchased for additional processing and resale.
$C+I+G+(X-M)=GDP$
Definition:
- $C\rightarrow$ Consumption
- $I\rightarrow$ Investment (Spending on new capital goods and additions to inventories)
- $G\rightarrow$ Government Investment (Expenditures on defense and nondefense goods and services)
- $(X-M)\rightarrow$ Foreign Trade (exports minus imports)
Limitations of GDP Measurement
- Household production (e.g., home-cooked meals)
- Resale (e.g., second-hand items)
- Underground economy (e.g., illegal activities)
- Leisure, quality, and variety (aspects of standard of living)
- Depreciation (e.g., a car going down in value)
- GDP does not reflect all costs (e.g., negative externalities)
Nominal vs. Real GDP
- Nominal GDP: The economy's output at current prices.
- Real GDP: The economy's output at current prices, adjusted for inflation.
Price Index Calculation
A price index is a number that compares the value of a variable in a particular year to its value in a reference year.
$PriceIndex = \frac{ParticularYear}{ReferenceYear}*100$
Consumer Price Index (CPI)
The Consumer Price Index (CPI) measures changes over time in the cost of buying a "market basket" of goods and services purchased by a typical family, indicating the cost of living.
- CPI is reported monthly, based on prices from sellers across the country.
Business Cycles
The business cycle describes the rise and fall of economic activity around the long-term growth trend of the economy.
Recessions and Expansions
- Recession: A decline in total production lasting at least six months.
- Expansion: A phase where the economy's total output increases.
Drivers of Long-Term Economic Growth
- Increases in the amount and quality of resources (labor and capital)
- Better technology
- Improvements in the "rules of the game" that facilitate production and exchange
Economic Activity and Growth Trends
Business cycles reflect movements of economic activity around a long-term growth trend line.

Economic Indicators
- Leading Economic Indicators: Measures that usually predict recessions or expansions.
- Stock market, manufacturing activity, inventory levels, retail sales, building permits.
- Coincident Economic Indicators: Measures that reflect peaks and troughs as they happen.
- Lagging Economic Indicators: Follow changes in overall economic activity; the business cycle influences these indicators.
- GDP, M2 (money supply, money in circulation), CPI, inflation, consumer confidence surveys, employment.
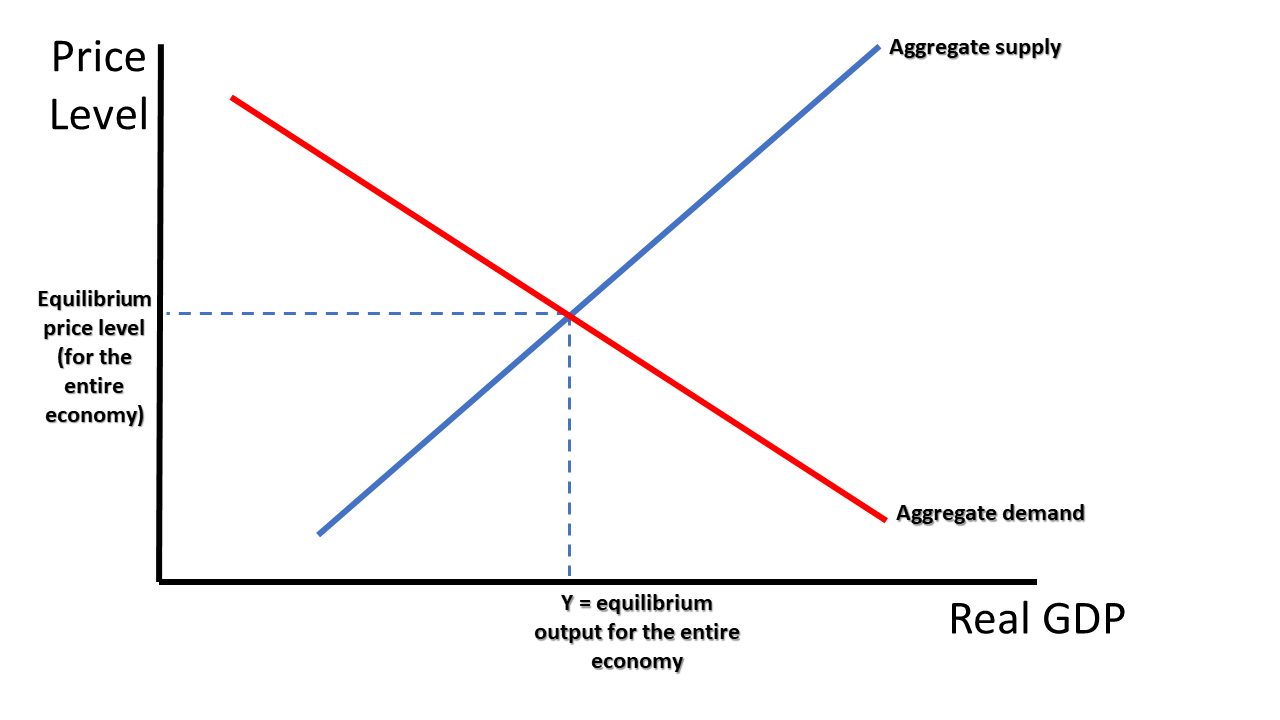
Aggregate Demand and Aggregate Supply
Aggregate Output (Supply): The total amount of all final goods and services produced by an economy during a given time (equivalent to GDP).
Aggregate Demand: All the products and services that all consumers, industries, and the government desire to purchase.
Example: During Covid, the demand line shifted to the left because people were spending less.
$C+I+G+X\rightarrow$ Aggregate Demand
Market Equilibrium
Equilibrium is the intersection of the aggregate demand curve and aggregate supply curve, which determines the levels of price and real GDP in the economy.
For parking around Grant, the supply curve is pretty much inelastic because no one is going to build more parking. However, for demand, because the price for parking is set to zero, there's a scarcity issue.
Economic Growth
Production Possibility Frontier (PPF)
- An outward shift on the PPF reflects more productive resources, better machines, or increased natural resources. These factors also increase economic growth.
- The amount of capital produced in one year will affect the location of the PPF the next.
- Economies that save more can invest and grow more (producing less consumption goods in the short term helps long-term growth).
Productivity
The standard of living is an economy's level of prosperity, often measured in GDP per capita.
Defining Productivity
Productivity compares total output to a specific measure of input. Using more of a specific resource efficiently instead of wasting it would be increased productivity.
Labor Productivity
Labor productivity is the output per unit of labor, enhanced by specialization, training, and education.
Human and Physical Capital
Human Capital
Human capital refers to the accumulated knowledge, skills, and experience of the labor force.
Physical Capital (Capital Goods)
Capital goods include machines, buildings, roads, airports, and other manufactured creations used to produce goods and services.
Capital Deepening
Capital deepening occurs when the quality and quantity of capital per worker increase, leading to more and/or better output per human hour.
Economic Standard of Living
Industrial Market Countries
These are developed countries, including Western Europe, North America, Australia, New Zealand, and Japan.
Developing Countries
These countries have a relatively lower standard of living, often characterized by less human and physical capital.
Growing your standard of living can be achieved by growing the PPF and increasing GDP. For a recently uncolonized nation, it is often more beneficial to invest in capital and human resources rather than solely exporting natural resources, especially if capital resources are scarce.
Group of Seven (G7)
The G7 consists of the seven leading industrial market economies: Canada, France, Germany, Italy, Japan, the United Kingdom, and the United States.
More education generally leads to more income for a nation. However, this can have drawbacks, such as potentially flooding the labor market and shifting the supply curve to the right, which could lead to a lower equilibrium wage and more people being paid less.
Research and Development (R&D)
Basic Research
Basic research is a search for knowledge without immediate regard for how that knowledge will be used (e.g., researching the structure of DNA).
Applied Research
Applied research seeks answers to particular questions with a specific purpose (e.g., researching how to make engines run more efficiently).
Impact of R&D Investment
Investment in R&D demonstrates an economy's efforts to improve the PPF through technological discoveries. Generally, the more people spend on R&D, the more the PPF grows.
Technology and Employment
Technology can affect employment rates, as efficient technology may replace human labor.
Unemployment
Types of Unemployment
- Frictional Unemployment: Always present in the economy, representing temporary transitions made by workers and/or employers (e.g., moving to a new city, layoffs, retirement, changing industries). It can also arise from inconsistent information between workers and employers, or a mismatch between supply and demand.
- Structural Unemployment: Occurs when job seekers do not have the skills demanded by the market. The unemployed may need to retrain. This can happen when new technology is introduced.
- Seasonal Unemployment: Caused by seasonal changes in labor demand during the year (e.g., ski lodge, ice cream shop, lifeguard). Demand shifts left, causing the equilibrium point to shift down.
- Cyclical Unemployment: An increase in unemployment caused by the recession phase of the business cycle.
Challenges in Unemployment Measurement
- Ignores Underemployment: Even if someone works at a job significantly below their skill level, it still counts as employment.
- Ignores Discouraged Workers: Individuals must be actively looking for work to be counted as unemployed.
Labor Force Definitions
The labor force consists of adults who are either working or looking for work. An individual can be part of the labor force and also unemployed at the same time.
Labor Force Participation Rate
The labor force participation rate is the number of people in the labor force divided by the total adult population.
Unemployment Rate
The unemployment rate is the number of people without jobs who are looking for work.
Total population $\rightarrow A + B + C + D + E + F$
Labor force $\rightarrow A + B$
Labor force participation rate $\rightarrow \frac{A + B}{A + B + C}$
Unemployment rate $\rightarrow \frac{B}{A + B}$
| Group of People | A | B | C | D | E | F |
|---|---|---|---|---|---|---|
| Adult | X | X | X | |||
| Children | X | X | X | |||
| Working | X | X | ||||
| Not working but looking | X | X | ||||
| Not working and not looking | X | X |
Unemployment Compensation
The Social Security Act of 1935 provides unemployment insurance, financed by a tax on employers.
Unemployment Benefits
Unemployment benefits are cash transfers to unemployed workers who actively seek work and meet other qualifications. These benefits help workers transition into jobs that better match their qualifications and prevent people from leaving the labor market, thus helping the circular flow of money continue.
Inflation
Definition: Inflation is an increase in the economy's general price level, where the equilibrium point between aggregate supply and demand rises.
Types of Inflation
- Hyperinflation: Extremely high inflation.
- Disinflation: A reduction in the rate of inflation.
- Deflation: A decrease in the general price level.
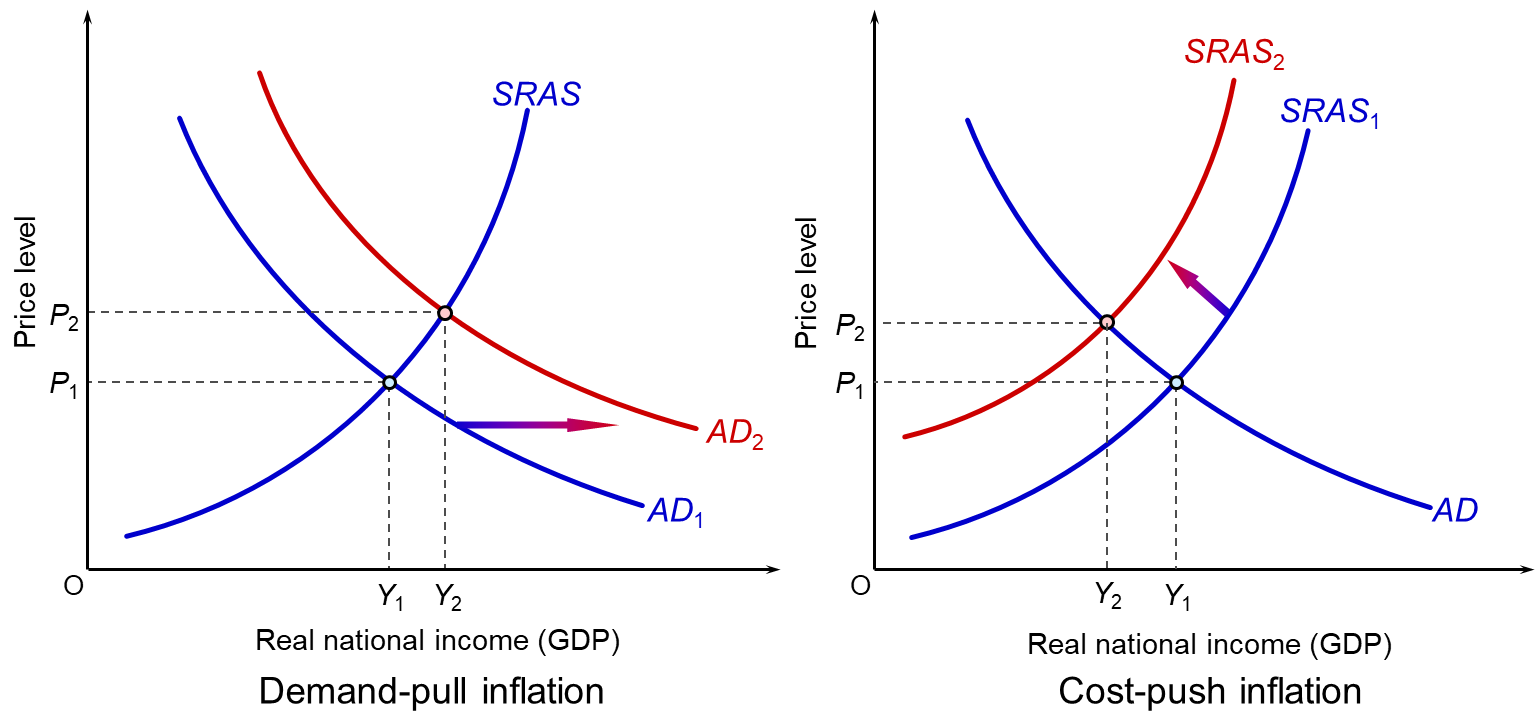
Sources of Inflation
- Demand-Pull Inflation: Inflation resulting from increases in aggregate demand (demand shifts right).
- Cost-Push Inflation: Inflation stemming from decreases in aggregate supply (supply shifts left), often due to firms leaving the market or businesses closing.
Impact of Unexpected Inflation
Unexpected inflation creates more problems for the economy than expected inflation, as it can cause economic winners and losers.
Economic Instability
The Great Depression
The Great Depression was characterized by:
- Household spending $\downarrow$
- Money supply $\downarrow$
- Poverty $\uparrow$
- Firms closing
- Household income $\downarrow$
- High unemployment
Laissez-faire Economics
(This section likely refers to the economic philosophy prevalent before the Great Depression, advocating minimal government intervention.)
Government Interventions in Economic Crises
Government actions to help an economic standstill (like in the Great Depression) include:
- Creating jobs (e.g., highway construction, national parks)
- Creating FDIC insurance (to restore trust in banks)
- Establishing social security programs
- Increasing government purchases
Definitions:Demand-Side Economics: A macroeconomic policy that focuses on shifting the aggregate demand curve as a way of promoting full employment and price stability.
Supply-Side Economics: A macroeconomic policy that focuses on a rightward shift of the aggregate supply curve through tax cuts or other measures that increase production incentives.
Public Goods and Services
Defining Public Goods
A public good is a commodity or service that is provided, without profit, to all members of a society (either by a government, private individual, or organization). Public goods are typically non-rivalrous.
Optimal Quantity of Public Goods
The optimal quantity of a public good refers to the balance between the quality/value derived from it and the cost to provide it.
Types of Tax Systems
- Proportional Taxation (Flat Tax): A fixed percentage of total income, which can affect lower-income individuals more significantly in terms of their disposable income.
- Progressive Taxation: Higher-income individuals pay a larger percentage of their income in taxes.
- Regressive Taxation: The opposite of progressive taxation, where lower-income individuals pay a larger percentage of their income in taxes.
Marginal Tax Rate
The marginal tax rate is where different ranges of your income are taxed differently.
Example:
- $0 - $20,000 $\rightarrow$ 10%
- $20,000.01 - $50,000 $\rightarrow$ 12%
- $50,000.01 - $90,000 $\rightarrow$ 15%
- $90,000.01 - $150,000 $\rightarrow$ 20%
Government Budgets
State Revenue Sources
- Grants, direct payments, contracts (33.4%) $\rightarrow$ Federal Funds
- Income tax, corporate tax, other taxes (23%) $\rightarrow$ General Funds
- Dedicated taxes, service charges (42.4%) $\rightarrow$ Other Funds
- Gas tax
- Insurance tax
- Registration fees
- Service charges
- Lottery money (1.2%) $\rightarrow$ Lottery Funds
State Expenditure Categories
- Human services (40.9%)
- Senior services
- Child welfare
- Self-sufficiency programs
- Education (17%)
- K-12 education (7.7%)
- Compulsory education
- Public schools
- Other education (9.3%)
- State colleges
- Training programs
- K-12 education (7.7%)
- Public safety, judicial (6.1%)
- Police
- National Guard
- Supreme Court
- Economic development (10.9%)
- Business support
- Infrastructure
- Apprenticeship
- Financial assistance (for businesses)
- Administration (16.5%)
- State offices and agencies
- Natural resources (2.8%)
- State land
- Soil conservation
- Water services
- All other (5.9%)
City Revenue Sources
- Property taxes
- Business licenses
- Lodging taxes
- User fees
City Expenditure Categories
- Public works (most of the expenditure)
- Community and economic development
- Budget and finance
- City operations
- Vibrant communities
- Public safety
Federal Revenue Sources
- Individual income taxes (49%) $\rightarrow$ From individuals
- Payroll taxes (35%) $\rightarrow$ FICA, Social Security (from businesses)
- Corporate income taxes (11%)
- Excise taxes (2%) $\rightarrow$ Tax on manufactured goods
- Customs duties (2%)
- Other revenues (2%)
Fiscal Policy
Defining Fiscal Policy
Fiscal policy is the means by which a government adjusts its spending levels and tax rates to influence the economy. It is primarily about taxing and spending.
Potential Output and Natural Unemployment
Potential Output: The economy's maximum sustainable output in the long run, also referred to as the full-employment output.
Natural Rate of Unemployment: The unemployment rate when the economy is producing at its potential level of output.
Addressing Economic Gaps with Fiscal Policy
If the Aggregate Demand (AD) curve shifts left (due to recession, disinflation, etc.), it can be shifted back to the right by:
- Giving stimulus checks
- Decreasing taxes
- Government buying from firms
- Creating jobs
Expansionary Gaps and Solutions
If unemployment is below the natural rate, there might be an expansionary gap, meaning the short-run output exceeds the economy's potential output. This can lead to issues like those seen before the Great Depression, where overproduction eventually leads to shutdowns and job losses. This can be solved by:
- Taxing households
- Making importing resources more expensive
Historical Context of Government Spending
Currently, 20% of all GDP is government spending. Before the Great Depression, government spending was significantly lower (around 3%). Keynesian theory was a major reason for this change.
Key Developments Supporting Fiscal Policy
Three developments after the Great Depression supported fiscal policy in the U.S.:
- The influence of Keynes's General Theory
- The powerful impact World War II had on output and employment
- The passage of the Employment Act of 1946, which aimed for high employment and stable prices, affirming government influence in the economy.
Tools of Fiscal Policy
- Discretionary Fiscal Policy: Taxes and budgets that change from year to year based on specific decisions.
- Automatic Stabilizers: Systems that automatically adjust for changes in the economy (e.g., progressive tax rates where more income means more tax, or unemployment benefits that kick in when jobs are lost).
Lags in Fiscal Policy Implementation
Different lags make fiscal policy problematic:
- Recognition Lag: The time it takes to identify a problem and determine its seriousness.
- Decision-Making Lag: The time needed to decide what action to take once a problem has been identified.
- Implementation Lag: The time needed to execute a change in policy.
- Effectiveness Lag: The time needed for changes in policy to impact the economy.
Federal Deficits and Debt
Money Supply Measures
- $2.5 trillion: In banknotes and coins.
- $18.5 trillion: In M1 (accessible money, like money in checking accounts).
- $21.8 trillion: In M2 (all money, including liquid money like banknotes, coins, M1, and less liquid money like Certificates of Deposit).
Crowding Out and Crowding In
- Crowding Out: High deficits lead to higher interest rates, which can result in less private investment.
- Crowding In: High government spending, despite leading to high deficits, can stimulate private investment.
Gross Debt vs. Publicly Held Debt
- Gross Debt: All debt.
- Debt Held by the Public: All debts the government has to repay to anyone outside the government. Currently, the U.S. government owes $36.2 trillion, with $28.9 trillion held by the public.
Debt-to-GDP Ratio
The Debt-to-GDP ratio is calculated as total debt divided by GDP. The higher this number, the more likely a nation is to default on its debts.
U.S. Economic Security Strengths
- The U.S. dollar's global dominance
- Investor confidence and "safe haven" status
- Strong and dynamic economy
- Federal Reserve's role
- Historical context
- Lack of immediate triggers for a fiscal crisis
U.S. Economic Concerns
- Increased interest costs
- Fiscal sustainability concerns
- Reduced fiscal space
- Potential for higher interest rates and inflation
- Erosion of confidence