Essential Statistical Concepts for Regression and Data Analysis
Classified in Mathematics
Written on in  English with a size of 369.85 KB
Key Statistical Concepts
Understanding Percentiles
The Xth percentile means X% of the data must fall strictly below it. The percentile of X can be calculated using the formula: (# observations (N - 1) / 2 / N * 100%).
Variance: Population vs. Sample
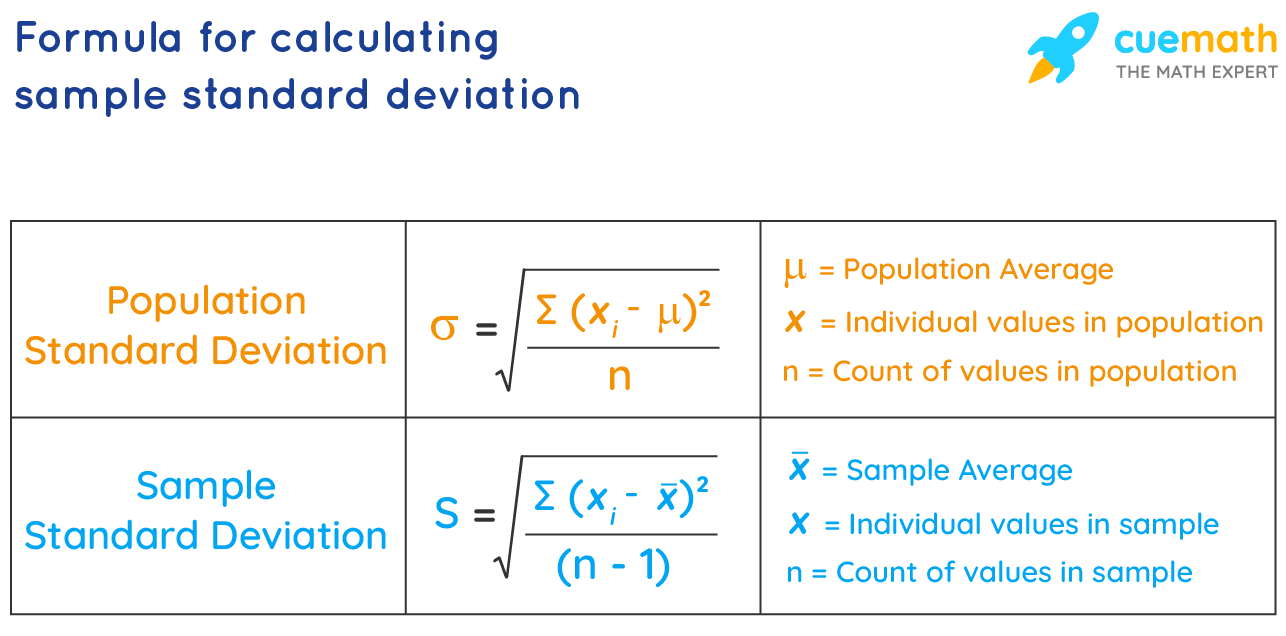
- The sample variance is the sum of the squared deviations from the mean divided by the number of measurements minus one.
- The population variance is the sum of the squared deviations from the mean divided by the number of measurements.
The Empirical Rule
Also known as the 68-95-99.7 rule, the Empirical Rule states that for a normal distribution:
- Approximately 68% of the measurements will fall within one standard deviation of the mean.
- Approximately 95% of the measurements will fall within two standard deviations of the mean.
- Approximately 99.7% (essentially all) of the measurements will fall within three standard deviations of the mean.
Standard Error of the Mean
The standard error of the mean (SE), calculated as s/√n, measures how far the sample mean (average) of the data is likely to be from the true population mean. It represents the standard deviation of mean values obtained from different samples.

Regression Analysis Fundamentals
Regression Coefficients and Standard Error
For regression analysis, key relationships involving the t-statistic, coefficient, and standard error are:
- t-statistic = Coefficient / Standard Error
- Standard Error = Coefficient / t-statistic
- Coefficient = Standard Error * t-statistic
Factors Influencing Coefficient Standard Error
The standard error of a coefficient is determined by several factors:
- Larger sample size → smaller standard error.
- Smaller Sum of Squared Errors (meaning data points are closer to the regression line, indicating a stronger relationship) → smaller standard error.
- More variability in the X variable → smaller standard error.
Residuals in Regression
A residual, also known as an error, is the difference between the actual observed value and the predicted value (Actual - Predicted).
Advanced Statistical Principles
The Central Limit Theorem
The Central Limit Theorem (CLT) states that the averages of samples drawn from any population will have an approximately normal distribution, regardless of the population's original distribution, provided the sample size is sufficiently large. As sample size increases, the distribution of sample averages becomes more narrow and clusters closer to the true population mean.
Multiple Regression Explained
While a single regression model is typically Y = β0 + β1X1 + error, the multiple regression formula is Y = β0 + β1X1 + β2X2 + ... + error. This model helps predict the dependent variable (Y) using multiple independent variables (X1, X2, ...). Regression chooses the intercept and slope(s) that minimize the sum of squared errors.
To convert categorical variables into numerical ones for regression, we create dummy/indicator variables. If multiple statistical methods are used for hypothesis testing, the majority result should be considered to determine the null hypothesis (H0) or statistical significance.
Why Use Multiple Regression?
Multiple regression is employed for two primary reasons:
- To obtain a more accurate or unbiased coefficient by controlling for confounding factors.
- To increase the predictive power of a regression model.
